

Page 57 [57]

OCR
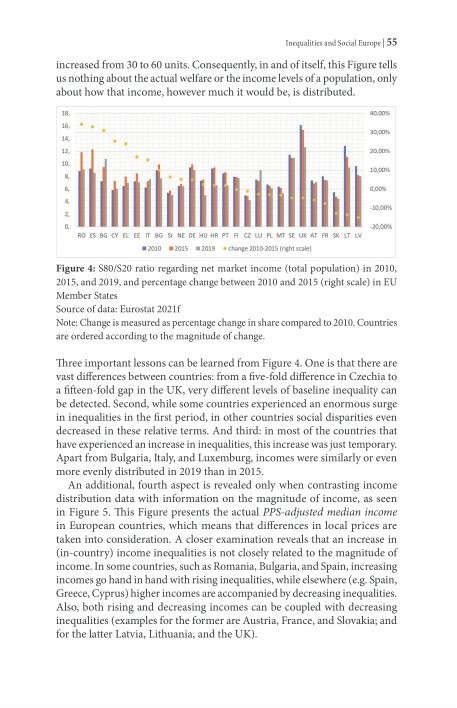
Inequalities and Social Europe | 55 increased from 30 to 60 units. Consequently, in and of itself, this Figure tells us nothing about the actual welfare or the income levels of a population, only about how that income, however much it would be, is distributed. 18, 40,00% 16; ES te ® 30,00% 20,00% ; ey ? . , 10,00% 8, of 6, 3 0,00% 4, -10,00% 2, 0, -20,00% RO ES BG CY EL EE IT BG SI NE DE HU HR PT FI CZ LU PL MT SE UK AT FR SK LT LV 2010 m2015 ™2019 € change 2010-2015 (right scale) Figure 4: S80/S20 ratio regarding net market income (total population) in 2010, 2015, and 2019, and percentage change between 2010 and 2015 (right scale) in EU Member States Source of data: Eurostat 2021f Note: Change is measured as percentage change in share compared to 2010. Countries are ordered according to the magnitude of change. Three important lessons can be learned from Figure 4. One is that there are vast differences between countries: from a five-fold difference in Czechia to a fifteen-fold gap in the UK, very different levels of baseline inequality can be detected. Second, while some countries experienced an enormous surge in inequalities in the first period, in other countries social disparities even decreased in these relative terms. And third: in most of the countries that have experienced an increase in inequalities, this increase was just temporary. Apart from Bulgaria, Italy, and Luxemburg, incomes were similarly or even more evenly distributed in 2019 than in 2015. An additional, fourth aspect is revealed only when contrasting income distribution data with information on the magnitude of income, as seen in Figure 5. This Figure presents the actual PPS-adjusted median income in European countries, which means that differences in local prices are taken into consideration. A closer examination reveals that an increase in (in-country) income inequalities is not closely related to the magnitude of income. In some countries, such as Romania, Bulgaria, and Spain, increasing incomes go hand in hand with rising inequalities, while elsewhere (e.g. Spain, Greece, Cyprus) higher incomes are accompanied by decreasing inequalities. Also, both rising and decreasing incomes can be coupled with decreasing inequalities (examples for the former are Austria, France, and Slovakia; and for the latter Latvia, Lithuania, and the UK).