OCR
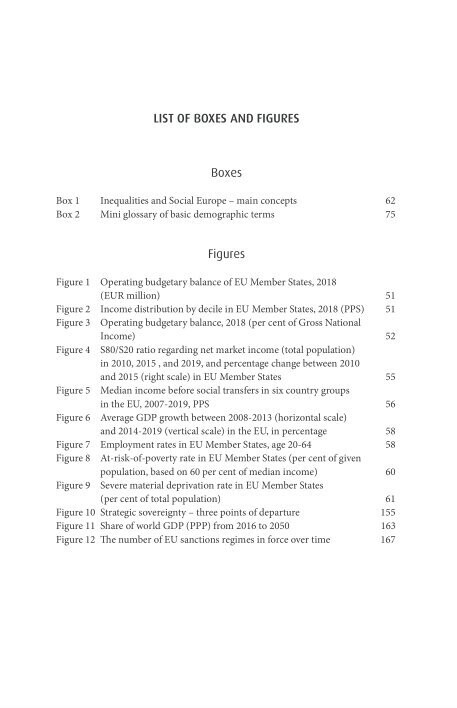
Box 1 Box 2 Figure 1 Figure 2 Figure 3 Figure 4 Figure 5 Figure 6 Figure 7 Figure 8 Figure 9 Figure 10 Figure 11 Figure 12 LIST OF BOXES AND FIGURES Boxes Inequalities and Social Europe - main concepts Mini glossary of basic demographic terms Figures Operating budgetary balance of EU Member States, 2018 (EUR million) Income distribution by decile in EU Member States, 2018 (PPS) Operating budgetary balance, 2018 (per cent of Gross National Income) $80/S20 ratio regarding net market income (total population) in 2010, 2015, and 2019, and percentage change between 2010 and 2015 (right scale) in EU Member States Median income before social transfers in six country groups in the EU, 2007-2019, PPS Average GDP growth between 2008-2013 (horizontal scale) and 2014-2019 (vertical scale) in the EU, in percentage Employment rates in EU Member States, age 20-64 At-risk-of-poverty rate in EU Member States (per cent of given population, based on 60 per cent of median income) Severe material deprivation rate in EU Member States (per cent of total population) Strategic sovereignty — three points of departure Share of world GDP (PPP) from 2016 to 2050 The number of EU sanctions regimes in force over time 62 75 51 51 52 55 56 58 58 60 61 155 163 167

