Page 75 [75]
OCR
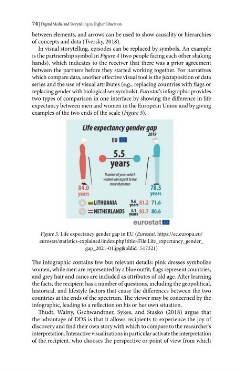
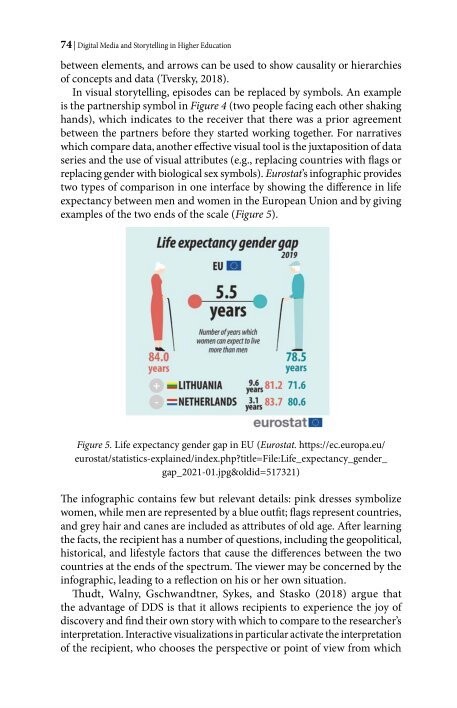
7A | Digital Media and Storytelling in Higher Education between elements, and arrows can be used to show causality or hierarchies of concepts and data (Tversky, 2018). In visual storytelling, episodes can be replaced by symbols. An example is the partnership symbol in Figure 4 (two people facing each other shaking hands), which indicates to the receiver that there was a prior agreement between the partners before they started working together. For narratives which compare data, another effective visual tool is the juxtaposition of data series and the use of visual attributes (e.g., replacing countries with flags or replacing gender with biological sex symbols). Eurostat’s infographic provides two types of comparison in one interface by showing the difference in life expectancy between men and women in the European Union and by giving examples of the two ends of the scale (Figure 5). Life expectancy gender gap 2019 EU El 5.5 A ee © years Number of years which women can expect to live 840 more than men 78,5 years years m= LITHUANIA 26,812 71.6 NETHERLANDS 3:1. 83.7 80.6 eurostat Figure 5. Life expectancy gender gap in EU (Eurostat. https://ec.europa.eu/ eurostat/statistics-explained/index.php?title=File:Life_expectancy_gender_ gap_2021-01 jpg&oldid=517321) The infographic contains few but relevant details: pink dresses symbolize women, while men are represented by a blue outfit; flags represent countries, and grey hair and canes are included as attributes of old age. After learning the facts, the recipient has a number of questions, including the geopolitical, historical, and lifestyle factors that cause the differences between the two countries at the ends of the spectrum. The viewer may be concerned by the infographic, leading to a reflection on his or her own situation. Thudt, Walny, Gschwandtner, Sykes, and Stasko (2018) argue that the advantage of DDS is that it allows recipients to experience the joy of discovery and find their own story with which to compare to the researcher's interpretation. Interactive visualizations in particular activate the interpretation of the recipient, who chooses the perspective or point of view from which