
Oldal 53 [53]
OCR
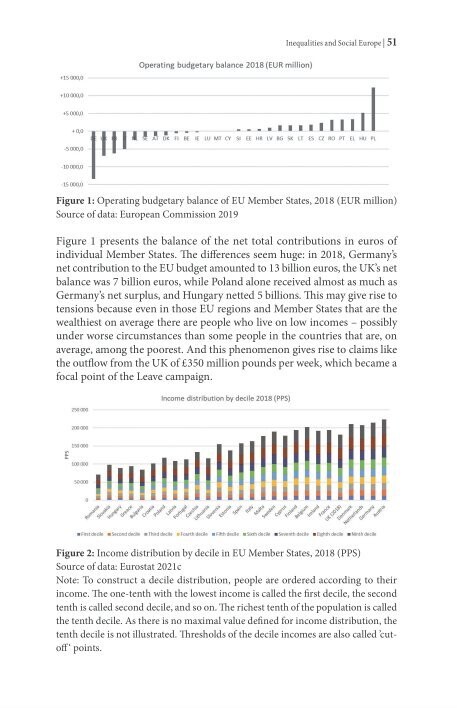
Inequalities and Social Europe | 51 Operating budgetary balance 2018 (EUR million) +15 000,0 +10 000,0 +5 000,0 +0,0 Eu = 57 | al a AT DK FI BE IE LU MT CY SI EE HR LV BG SK LT ES CZ RO PT EL HU PL -5.000,0 -10 000,0 -15 000,0 Figure 1: Operating budgetary balance of EU Member States, 2018 (EUR million) Source of data: European Commission 2019 Figure 1 presents the balance of the net total contributions in euros of individual Member States. The differences seem huge: in 2018, Germany’ net contribution to the EU budget amounted to 13 billion euros, the UK’s net balance was 7 billion euros, while Poland alone received almost as much as Germany’s net surplus, and Hungary netted 5 billions. This may give rise to tensions because even in those EU regions and Member States that are the wealthiest on average there are people who live on low incomes - possibly under worse circumstances than some people in the countries that are, on average, among the poorest. And this phenomenon gives rise to claims like the outflow from the UK of £350 million pounds per week, which became a focal point of the Leave campaign. Income distribution by decile 2018 (PPS) S &. 250 000 200 000 150 000 100 000 50000 : ! | 0 e > N ee S ES PPS o A ee @ à > 2 Ss À 2 D # 8 SPS SS EF SS SS s S 9 LE PES S x OEL ő PP OFF oF E ES & ag eS SF FV Fw € SO & s 39 & Te se & x e * x mFirstdecile mSeconddecile mThirddecile mFourthdecile mFifthdecile mSixthdecile mSeventhdecile mEighth decile mNinth decile Figure 2: Income distribution by decile in EU Member States, 2018 (PPS) Source of data: Eurostat 2021c Note: To construct a decile distribution, people are ordered according to their income. The one-tenth with the lowest income is called the first decile, the second tenth is called second decile, and so on. The richest tenth of the population is called the tenth decile. As there is no maximal value defined for income distribution, the tenth decile is not illustrated. Thresholds of the decile incomes are also called ‘cutoff" points.