
Oldal 97 [97]

OCR
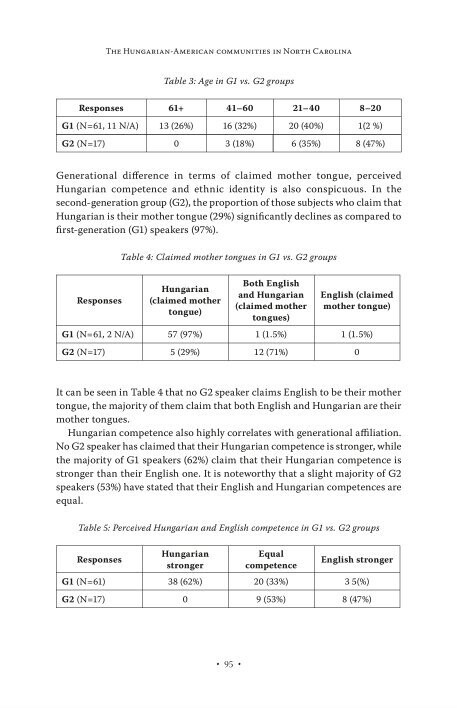
THE HUNGARIAN-AMERICAN COMMUNITIES IN NORTH CAROLINA Table 3: Age in Gl vs. G2 groups Responses 61+ 41-60 21-40 8-20 G1 (N=61, 11 N/A) 13 (26%) 16 (32%) 20 (40%) 1(2 %) G2 (N=17) 0 3 (18%) 6 (35%) 8 (47%) Generational difference in terms of claimed mother tongue, perceived Hungarian competence and ethnic identity is also conspicuous. In the second-generation group (G2), the proportion of those subjects who claim that Hungarian is their mother tongue (29%) significantly declines as compared to first-generation (G1) speakers (97%). Table 4: Claimed mother tongues in G1 vs. G2 groups Hungarian Both English Responses (claimed mother and Hungarian | English (claimed P (claimed mother | mother tongue) tongue) tongues) G1 (N=61, 2 N/A) 57 (97%) 1 (1.5%) 1 (1.5%) G2 (N=17) 5 (29%) 12 (71%) 0 It can be seen in Table 4 that no G2 speaker claims English to be their mother tongue, the majority of them claim that both English and Hungarian are their mother tongues. Hungarian competence also highly correlates with generational affiliation. No G2 speaker has claimed that their Hungarian competence is stronger, while the majority of Gl speakers (62%) claim that their Hungarian competence is stronger than their English one. It is noteworthy that a slight majority of G2 speakers (53%) have stated that their English and Hungarian competences are equal. Table 5: Perceived Hungarian and English competence in G1 vs. G2 groups Responses Hungarian Equal English stronger stronger competence G1 (N=61) 38 (62%) 20 (33%) 3 5(%) G2 (N=17) 0 9 (53%) 8 (47%)